Runscribe is a real biomechanics lab under your feet. Before Thanksgiving 2016, Massi got a phone call from his San Diego’s friend suggesting to buy a new running toy to support running form and reduce injuries going forward. The marketing motto was probably not how Runscribe wanted to promote its key product but we decided to test it for multiple months. During Christmas we had the chance to assess properly Runscribe’s abilities: immediately we felt in love with the tool and in March 2017 we published the Runscribe Italian review, which was one of the top reading among Italian runners. Few months down the road we decided to improve the original version, add more accurate data, using the new Infographics style we have adopted with Pitt 2.0 and make the English version available as well.
 What is the Runscribe? Scribe Lab, a company based in San Francisco, California, introduced few years ago a footpod in the view of helping the world of running to improve their running technique and reduce injuries. Thanks to improvement in technology we are now able to monitor and measure several parameters of the biomechanics of running. Runscribe’s target fits our Therunningpitt.com mission: they want to democratize the data on running, namely to move advanced metrics outside the lab and take them onto the tracks and field. In other words, Runscribe allows the running community to monitor their training by using an incredible set of data. Runscribe’ brand proposition is to allow users to reduce injuries, improve running economy and run faster by having accurate data with a simple and reliable tools.
 Has actually Runscribe hit its target? What are the main features making Runscribe something really different from other competitors available on the market? And how can you achieve real improvements thanks to Runscribe? How can we transform the data interpretation into actual and concrete actions? Would we/you recommend the purchase? To which type of users?
Runscribe footpods: how to run injury free with data driven tool
Having tested the Runscribe foot pod on a daily basis for almost 7 months, run two marathons with it, including one sub 2h30, we believe we can make a very objective judgment on its functionalities, on their usage and overall on the practical usefulness of this new gadget for runners. Thanks to the daily running we were able to achieve an incredible collection of Runscribe tests and data analysis with in-depth view for all tastes. Unfortunately we did not wear Runscribe in Breda, the Netherlands, when we run our first ultramarathon of 68.6km, in 4h32 minutes but we believe that our test were quite accurate nevertheless. Before getting started, we want to acknowledge that this review could have not been possible without the support of Maurizio Zugna, who became our English curator and collaborates with our site to expand our audience globally.
Runscribe in brief
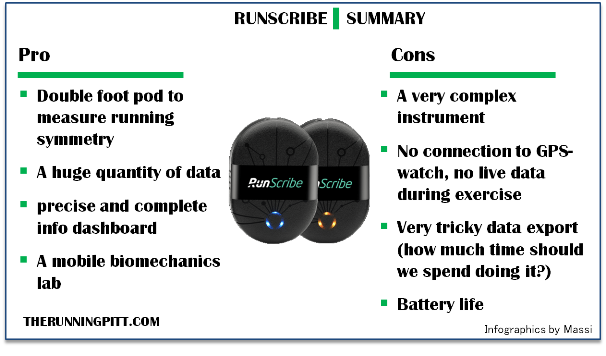 Do you think that you don’t have enough time to read the whole article? In less than 200 words including a brief graphic section we summarize pros and cons of Runscribe. Clearly we recommend the full reading especially if you are planning to buy it or whether you already have it. Main features and benefits:
- Its unique double foot pod measures our running symmetry on analytical way
- A huge quantity of data
- precise and complete info dashboard
- A mobile biomechanics lab
Main concerns from an user standpoint
- A very complex instrument
- No connection to GPS-watch, no live data during exercise
- Very tricky data export (how much time should we spend doing it?)
- Battery life
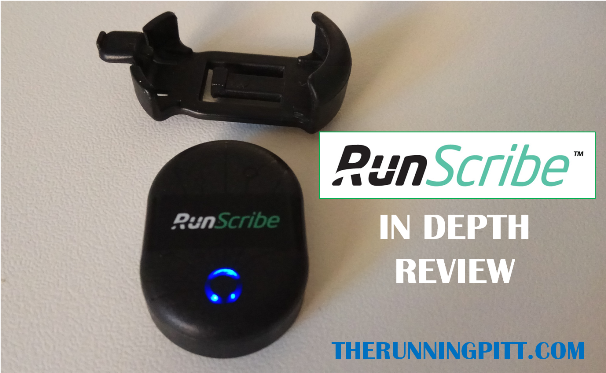
Briefly, Runscribe is a running sensor which uses 2 tiny smart pedometers so to measure your own way of running. Tight it on your shoes and once your training is completed, you can determine your running dynamics. You will be able to estimate potential biomechanics problems such as imbalances, to figure out how your running technique, shoes or the ground is influencing your way of running. We think this is a very interesting instrument, although very complex, in due time it will replace the lab tests we, amateur runners, cannot afford to use. However nothing will be able to replace your coach recommendations, Runscribe might help you with interesting data which will allow to improve your running technique.
Unboxing
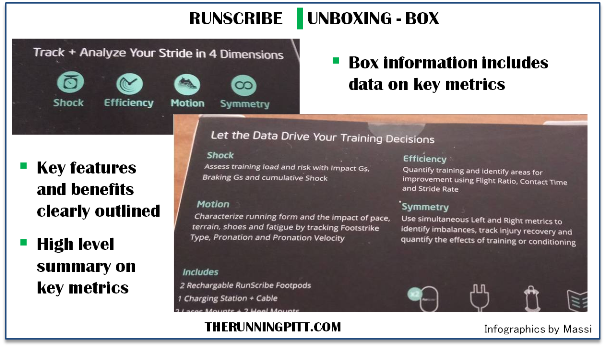
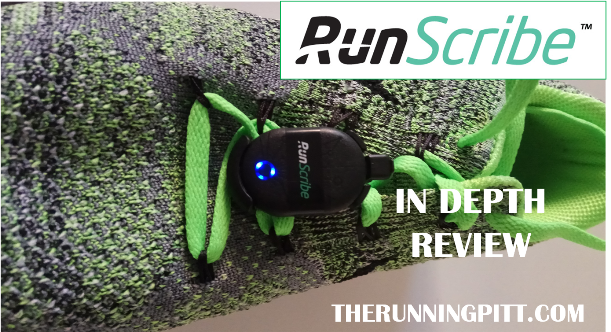
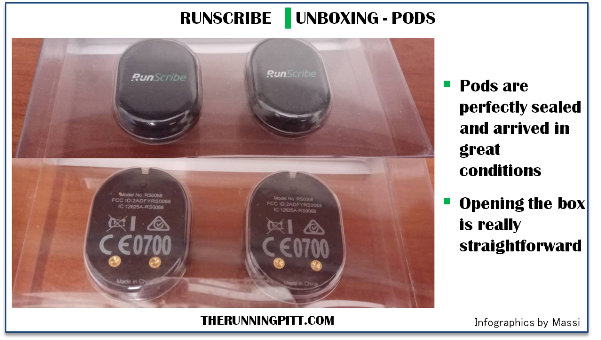 The box and the user manual are really tiny, but box explanations are very clear. In few minutes I realized immediately how to use the pods. The most interesting aspect, once you open the packages, is that everything is doubled…. because the box contains two foodpods, with Bluetooth Low Energy sensors but also Ant+ very lookalikes to Garmin foot pod with a multicolor flashing light. Both are equipped with a double clip so to position them either on the front side, same as normal foot pod, or on the back side of the shoe. In addition to the sensors and double clips, the box includes a micro USB wire, a portable battery charger which can be easily transported on board of airplanes. Once you unbox it and read the ten-pages-user-manual you can start running, after following three simple rules. First of all, you need to charge up the sensors and download the Runscribe app on your smartphone. This task will allow you to set up the 2 foot pods separately, choosing the color to identify the right from the left one. Together with my 6 years old daughter we opted for green and blue but other four colors were also available. Last step before running is tightening the sensors to your shoes. Being very conservative we preferred for a traditional front position so to avoid losing them if placed on the back of the shoes. Both positions are possible and none is preferred. You need just to tick your choice on the app; lastly the connection must be well fixed on your shoe so to avoid unnecessary vibrations which might influence the data collection. The ideal positioning varies to the type of shoe but Runscribe recommends a spot with an angle between 35 and 40 degrees which, generally, means the middle position.
Shouldn’t be just four steps? Have you forgotten the GPS link?
The Runscribe system
Runscribe has a great advantage which, for some is also its limit: it does not connect to your GPS. Why? Is this an actual problem? In fact the Runscribe system is completely autonomous from any GPS and will start recording data as soon as you start running. Runscribe stores data only if running cadence is over a certain level. This is really a useful function. And if that was not enough the app allows you to “cut” the initial or final part of your training in case you are not interested in saving the warm-up or the cool-down parts. At the end of the training, data will be exported via Android or iOS and thereafter you can view them. Obviously Runscribe includes the option to operate via web, a much more complete instrument. At the very first data transfer, we immediately figured out that the quantity of information is really impressive. For example, for a 2 hours running session, the footpod will download the data in less than 5 minutes. As well as Strava, once the data are uploaded, you will need just to assign various tags such as shoes, terrain, type of training and muscle and joint pain, if any.
Really innovative objects. Soon we will be seeing the available metrics but first it is really important a tech advice. Inside the food pod Runscribe you cannot find only a tri-dimensional accelerometer but also a gyroscope and a magnetometer. These three instruments can capture in a very sharp way the 360 degree movement. Obviously then the data processing and data visualization algorithms will make the difference between a normal product and an excellent one such as Runscribe. Data recorded are so innovative that, still today, there is no available GPS able to support them. Perhaps down the road Garmin IQ version 2 installed on Fenix 5 will make the connection to watches possible. The management of Runscribe is supporting carefully its technological evolution but so far it is impossible to make talking Garmin and Suunto with such two objects. We hope that the landscape will change with the introduction of standardized running dynamics from the Ant+ association. But as of July 2017, there is no sign that integration between Runscribe and GPS will be fast.
Runscribe tracking metrics: follow the data
As well as all technologies based on accelerometers also Runscribe has got a plethora of data with the target to measure many running parameters for the use of all amateur runners. But what do they need? What do they measure? How are they displayed?
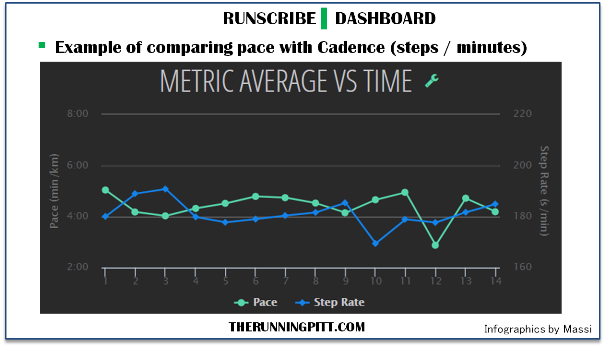
Runscribe metrics. Runscribe has 14 different metrics. The first four are traditional: the number of steps made during the training, the distance in kilometers, the average speed expressed in min/km, the cadence in step/min. Other two are also available on the Garmin running dynamics: the length of the step in meters and the ground contact expressed in milliseconds.
 Dashboard tool. Runscribe developed an info-dashboard named “Runscribe dashboard” which shows in a very intuitive manner the summary of your training to those who had no time to read in details the various metrics.
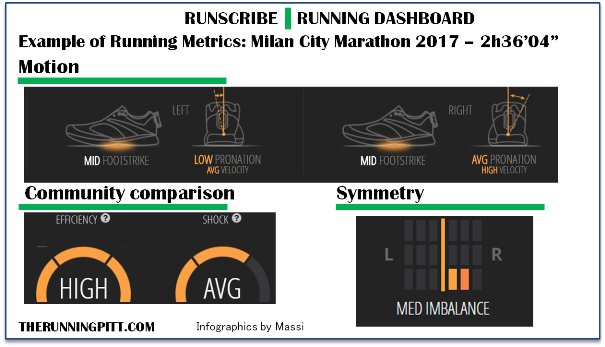
- Motion: what is your foot rest style? Runscribe estimates which part of your foot gets in touch with the ground first.
- Pronation: do you pronate? Or supinate?
- Synthesis of symmetry: is your running style properly balanced?
All such data are mathematically determined in the follow up with dedicated metrics, we cannot deny that since the first days we only focused on the summary since it is well done and give good indications on how to improve.
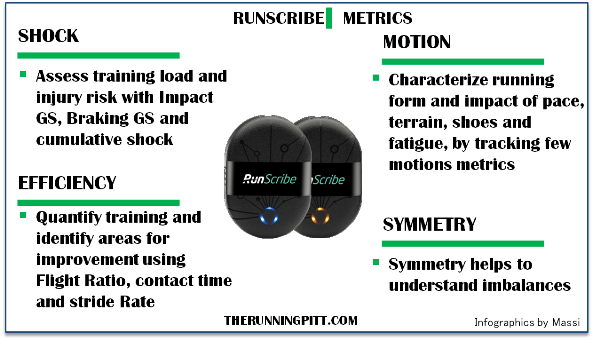
Innovations. After few days of usage, the curiosity of the fresh owner of the Runscribe system got the power. To analyze the eight metrics is very intriguing for their uniqueness. Mainly the data can be split in three categories: in particular those helping you to evaluate your running efficiency. Then there are other metrics analyzing the running shock and those for the movement/motion. Since there are 2 foodpods, for each one of the metrics we can calculate the running symmetry, really a different level of analysis compared to what provided by Garmin on balance!
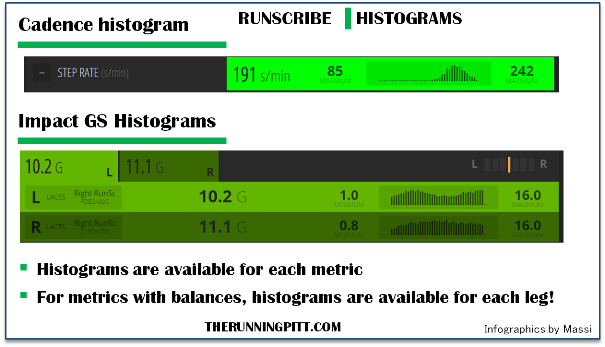 Histograms. For the first time, the info-dashboard doesn’t show only the average figure and its trend throughout the time. Runscribe activated an histogram function with the aim to analyze how the metrics are spread and allow an instant comparison between left and right foot. This is a great feature to analyze possible unbalancing and recommend possible improvements. We truly believe that it is necessary to use such instrument together with slow-motion filming like Kinovea. Filming is an integral part of your improvement, if you don’t know how to do it, we suggest that you read Running Revolution by Nicolas Romanov.
Users comparison. Runscribe also introduced the possibility to compare users among the community. It is basic data, but also powerful tool: how do you know otherwise whether your posture is good, without proper comparison? We believe that in the future Runscribe will also include sorting by age and other characteristics.
Getting back to the 3 types of data we will be focusing on one main question: what are they for? The reading of the next paragraphs is for analytical runners, if you find something puzzling, our infographics aims to simplify the concepts and get you the main idea.
Runscribe, running dynamics and running efficiencies
 In order to analyze with an actual example, since my daughter rejected the idea of being filmed while running, we have run the 2017 Milan Marathon in 2 hour and 36 minutes and provided our key findings in this article. In the Italian version of the Runscribe article, we used data from Emma Coburn and inferred her running dynamics but here we prefer to be more precise and gives you a better indication on what are the key advantages of using Runscribe as data driven tool for Runners. Here we did not trim the data, and in fact Runscribe shows 3 hours and 1 minutes for the marathon, since it includes also warm up and cool down.
 In the italian version of the site, we talked about running efficiency, describing the relation between the length of the step and the cadence. We analyzed the cadence of Italian runners on Strava. To simplify the matter, the running speed is a function of both variables but in order to gain real benefits, you must attempt to train without changing too fast your way of running. We run the half marathon at 185-190 steps per min with an average length of 1 meter and 30 to 50 cm.
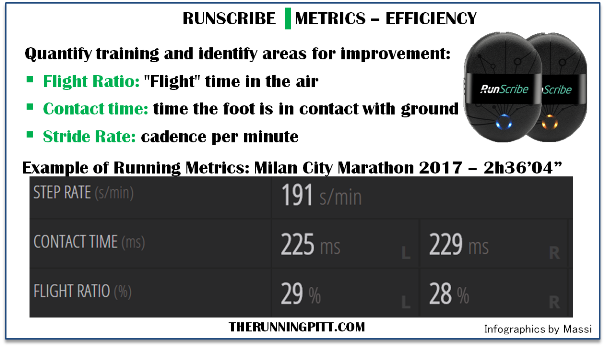
Nothing new so far: we don’t need Runscribe to get such data! The real new is that Runscribe calculates the flight ratio, meaning that it calculates the time on air when none of the feet touches ground. During walking this relation is equal to 0% while running it tends to increase. The faster the running speed the higher this figure will be, on Runscribe database they estimate that at running at 4’20” min/km this ratio will be at 15% when if the paste is 4’00” it raises to 23%. On the fast half marathon we spend between 40 and 50% of our time flying, not bad and just little shorter than the running professionals. During the Marathon our ratio was constantly to 28-29%, as outlined in the Infographic. Contact time looks higher, 225 ms to 229 ms, than what we measured in other marathons, but quite consistent with my running style.
Also very interesting are indeed two other metrics about shock and movement analysis.
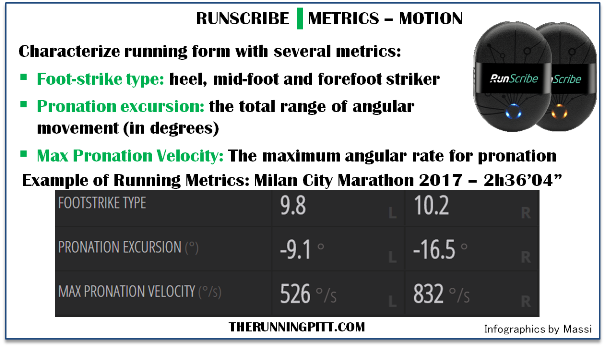
Running dynamics: movement metrics
The movement metrics analyze what happens when the foot touches ground. In other words, it determines the type of foot strike. Moreover Runscribe estimates how the foot moves to pronation and at what speed this happens. McDougall claims in his book “Born to Run” that the heel strike has double chance of injury compared to those runners landing on the forefoot. However, the attentive reader will note that the Harvard studies had no supporting materials from others (for example Kleindienst, 2003 and Walther, 2005). However, the real news is that the Runscribe database will be able to provide new light on such subject in some years basing on a really significant sample.
For what concerns the pronation, the movement is completely natural, being an effective mean of force absorption of impact on the ground. Runscribe measures the range of the pronation, meaning the interval of the angle movement (in degrees) of the foot toward the inside between the foot heel and the point of max pronation. Even the pronation was seen as a possible risk of injury, we hope the database Runscribe will enlighten us on such matter.
In brief, the shock indicators are the following:
- Type of foot strike: forefoot, midfoot, heel
- Pronation excursion: it calculates the angle of pronation of the foot from the moment it touches ground till max pronation
- Max Pronation Velocity: the max speed of pronation between the moment the foot touches ground and the point of max pronation
At the Milan Marathon our performance was consistent: we are clearly midfoot runner, while the right leg is faster than the left.
Running dynamics: shock metrics
 We believe that the shock metrics are really interesting. As everybody knowns, from a biomechanical point of view, the running generates an heavy impacts of the foot on the ground. Such shock generated by the foot is then transmitted to the whole body. Runscribe is able to calculate (indirectly) its impact through the changes of speed as determined by the accelerometer. Runscribe estimates an index for the potential risk of injuries, the higher this number, the higher such risk. The two indicators are therefore:
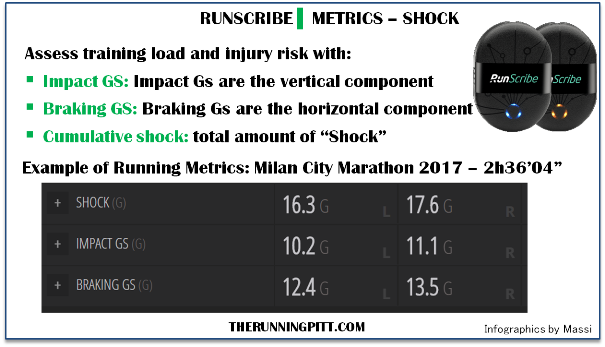
- Impact Gs: calculation on the impact of the vertical forces given by the foot impact on the ground
- Braking Gs: calculation of the horizontal impact
We show an impact GS at 10 G and a Braking GS at 12 G compared to the average runner who has an higher value for the vertical impact (because of the heel support) and a lower number for the horizontal (because the impact was already cushioned by the heel). We believe that we should work to improve these parameters with some Strength and conditioning for Endurance runners.
Running Dynamics: symmetry
Finally, the running symmetry. The beauty to have two sensors is that Runscribe is able to calculate the full data set for each single leg avoiding the measuring via the cardio heart rate monitor.
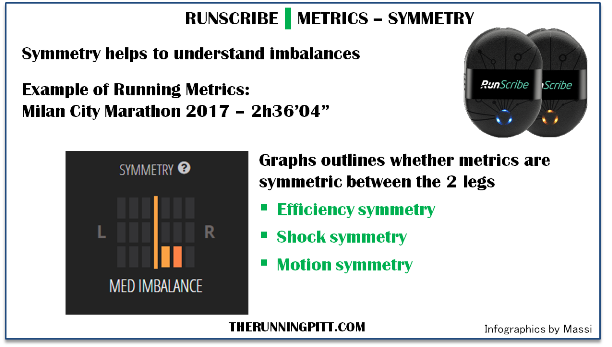
 Symmetry. Precisely for the reason outlined above, Runscribe will verify the symmetry in all metrics. Till now it has been very difficult to measure possible imbalances analytically, from now on we will be able to answer to questions such as: is the support symmetric? Do we raise the legs in the same way? Do we need to strengthen one leg vs the other? For example in my case, with low drop shoes at a relative high speed, I am going to rest on the forefoot on my right foot, while the left I will support by midfoot and tending to heel in certain situations. Clearly Runscribe will be used as informative diagnosis but for the time being they haven’t activated recommendations on what to change on your running mechanics. And, as in many other cases, complex data requires the involvement of an expert for the proper interpretation. And what about the marathon? Well, by looking at the infographic, we run quite symmetrically, except for the motion metric.
Calibration and Battery life
Since the system Runscribe doesn’t connect to any GPS watch, it needs by definition to be “calibrated”. How long does it take? And above all, once calibrated, is it precise? What about the use on the treadmill?
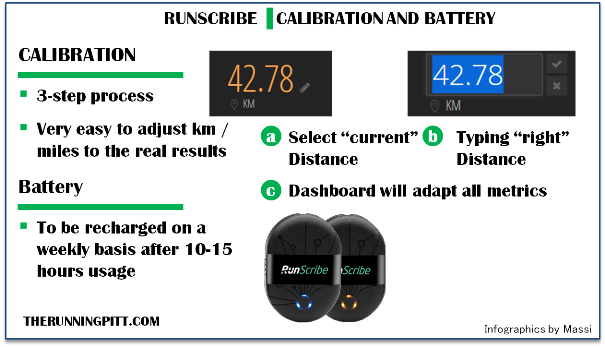 Calibrate the food pod. Exactly for the above mentioned reason, it is essential to update the distance during the first week of running. The calibration is an easy task: once extracted the data from the pedometer, you will just need to take the length of your running and import it into the synthesis of your training. With the passing of the days the algorithm of calibration will influence the calculation of the distance and, providing that you run on the same route, in few sessions you will get a result surprisingly accurate. Browsing on the Runscribe forum it seems that other users found the process is working fine unless the way of running varies according to your running speed.
Runscribe on treadmill. We completed several runs on treadmill with Runscribe. Even in this case we were not surprised by the quality of the outcome, we actually recommend to use it on the treadmill so to understand how is your running technique in ideal conditions, may be running slowly for 50 minutes but collecting very interesting information.
How does your running technique vary compared to the speed? We faced this subject some time on the analysis of the running dynamics on Garmin second part, unfortunately in Italian but with Runscribe we can get much more detailed studies. According to our data, we see the same relationships already outlined, but we are welcome to receive comments and additional suggestions for studying the matter.
Battery life. By reading the technical specs of Runscribe the battery should have a life of 16 hours, according to our tests, instead, the food pods last only around 10 hours. Because I’m often on the go, most likely during transport Runscribe burns a part of the charge. From the app you can check the battery life and understand when and if to recharge the pedometer. Furthermore the color lights will start flashing when the battery is almost dead. After all a very well done system, the battery life is more than enough even for the most demanding runner.
Who needs Runscribe?
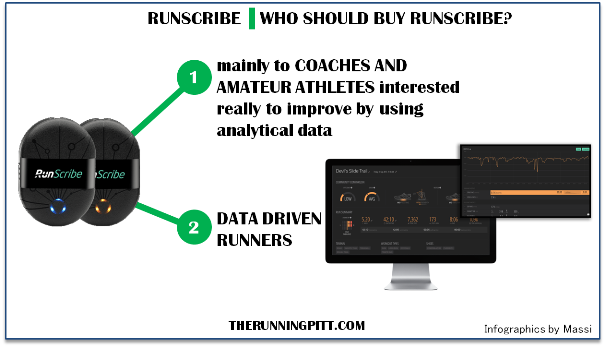 Runscribe isn’t for everyone, the display running dynamics are incredibly complicated, it takes months to understand how to use them properly. And in fact Runscribe doesn’t winks to weekend joggers but mainly to trainers and amateur athletes interested really to improve by using analytical data. Surely the info are so detailed that, according to the California company, will allow to understand what could be the potential injuries risk factors and the impact on the use of a certain type of shoes. On the first point, however, if you don’t have a detailed knowledge of biomechanics hardly you will be able to establish the potential impact of the injury. And even combining all data it will be hard and complex to create a very sophisticated model on when the runner will get injured.
Shoes analysis and ground impact
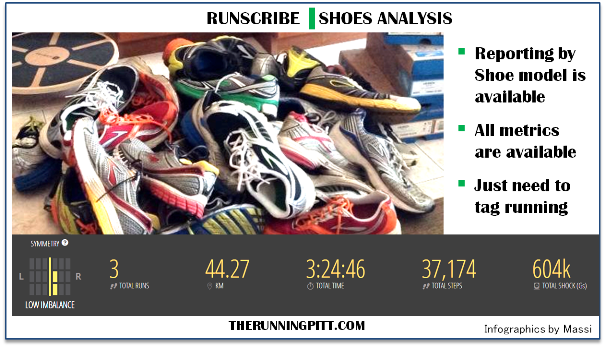 One of the most interesting aspect of the new technology by Runscribe is the possibility to analyze the impact of our shoes on the running. On a video published several times on all Social Network we have watched the author of “Natural Running” runs on a track with different types of shoes. At the end of the video there was an implicit note saying that, if we are able to optimize the running technique, then it is almost irrelevant which shoes you are wearing. Obviously Daniele Vecchioni, the founder of the site, recommended anyway to wear “minimal” shoes. Is it really true that the shoe type doesn’t have any impact of way of running? According to the data analysis from Runscribe over a four-months period, we believe that the way of running depends strongly on the choice of shoes wear! It has been very fascinating to analyze how the running metrics vary depending on the shoes used. You don’t need a master’s degree in Statistics to calculate multiple and nonlinear regressions, the Runscribe data dashboard will show you the comparison among the data of all your shoes in a very intuitive way.
Measure the effort. Runscribe, other than the shoes, is able to “modelize” even the effort/fatigue. We all have read the studies summarized by Steve Magness in his book “The Science of Running”. One of the main theories of this book is that in a long endurance race you tend to reduce the speed due to the fatigue. It is also possible that fatigue has an impact on your way of running and on your foot support. According to Magness and other authors, the fatigue has relevance on the neuromuscular control in a runner. A at certain stage of the race not all muscular fibers will be activated because the brain will attempt to retard the wearying. Therefore as the time pass the runners will be “less” able to soften the impact on the ground. Analytically, using the metric of Impact GS, you will notice that in the graph of a marathon this will tend to increase during the race.
Ground impact on the way of running. Also the type of terrain will influence the way of running since you don’t have the same type of support. We are not able to generalize the idea, but Runscribe offers the option to gather reporting by terrain and suggest how to improve your running form depending on where you run.
Conclusions
Like in all innovative technologies recently introduced on the market, Runscribe showed very promising functions which, in some time, will more adopted by people like us, amateur runners. If you are a running coach or a data runner nerds, you cannot miss these two sensors which flash and change colors. But, most of all, you cannot miss the data from the Runscribe dashboard: for a less-than-two hundred-dollars you probably will be able to understand the potential causes of inefficiency of your running. Bear in mind that the final goal of amateur runners such us is to stay fit and sound and being able to run forever. I still haven’t understood completely how to use the data to improve my running style. I need to spend more time with my running form adviser Pierpaolo, but with the analysis of data and the actual use I believe Runscribe can always improve my running in the “long-run”.
The Runscribe footpods are available on Amazon.com, and directly on Runscribe website (FREE SHIPPING!). If you appreciated the review, please buy with those links, so that we can get a small commission to support the site in reviewing new items.
For deeper analysis on Runscribe and on running mechanics
This article should have helped you to understand whether Runscribe can enter into you future technological arsenal. We attach herewith some links for further insights other than purchasing Runscribe:
- Our review of Garmin running dynamics (in Italian)
- Our review on running dynamics Tickr (in Italian)
- The detailed review of Stryd (in Italian, soon in English)
- Running Revolution: the review on the book from Romanov (in Italian)
- Link to buy Runscribe on Amazon,US site
- Link to buy directly on the site Runscribe, FREE SHIPPING!